Collecting activations for an SAE: a roofline, a writer, and a profiling pass
The next thing I want to do is train a sparse autoencoder (SAE) on GPT-2’s residual stream. But an SAE trainer is boring in the best way: it’s an autoencoder, so it doesn’t care about labels, prompts, or order — it just wants a big pile of activation vectors to reconstruct. So step zero is unglamorous plumbing: run a model over a few thousand prompts, grab the residual stream at one layer, and get tens of millions of vectors onto disk in a form the trainer can shuffle through.
I’ve done activation collection before (for an emergent-misalignment replication), so I expected to move fast. I did — but the interesting part wasn’t the collection, it was that building it well forced me to answer three performance questions I usually hand-wave: what batch size, and how do I know? is this compute- or IO-bound? and where is the time actually going? This post is the answer to all three, worked out empirically on a single H100. The code is on GitHub. As with my GPT-2 repro and post-training notes, a lot of it was worked out in conversation with Claude.
The target: gpt2-xl (1.5B, 48 layers, d_model 1600), residual stream at one hook point, ~30M tokens, written as shards ready for SAE training. Artificially cap myself at 100 GB CPU RAM and 200 GB disk to keep the design decisions honest.
The design that dissolves the hard parts
Two decisions up front make most of the classic activation-collection headaches disappear.
Pack, don’t pad. The obvious approach — batch variable-length prompts, pad to the longest, run the model — drags in an attention mask, forces you to exclude padded positions when you store activations (last time, forgetting this gave me NaNs downstream), and leaves you with ragged batches you have to rebalance. Instead I tokenize the whole corpus, concatenate the token ids, and slice into fixed 1024-token chunks. No padding, no mask, no NaN, uniform batches (so the GPU is always doing the same-shaped work), and the output is naturally a clean [N_tokens, d_model] matrix — exactly what the SAE consumes. Every stored row is a real activation.
Stop at the layer you want. If I’m capturing resid_post at layer 7, there is no reason to run layers 8–47 or the LM head. I physically truncate the model’s block list to the first 8 blocks and run the base transformer; the forward simply ends after the layer I care about. On an early layer that’s a ~6× compute saving over a full forward, and — usefully — it’s compatible with torch.compile (no mid-graph exceptions, which the raise-to-early-exit trick would need).
Storage is safetensors shards, ~1M rows each, written append-only and atomically (tmp → fsync → rename). Append-only is what makes resumability trivial: a manifest.json records how many chunks are done as a contiguous prefix, so if the job dies at chunk 4,000 of 29,000 I restart, skip the finished chunks, and continue. A crash can lose at most the in-progress shard, which is simply redone. Shards are also the shuffle unit for the trainer later, and safetensors is mmap-friendly and doesn’t execute code on load.
How big a batch? Ask the roofline, not your gut
My instinct said “big batch = good throughput, push it until you OOM.” The memory math even encourages this: the residual tensor you keep is only ~3.3 MB per example (1024×1600×2 bytes), and with FlashAttention the giant [B, H, T, T] attention matrix is never even materialized, so HBM has enormous headroom — you could fit a batch of ~2000.
That instinct is wrong, and a five-minute sweep shows why. I ran the truncated forward on random token sequences across batch sizes and measured throughput and achieved compute:
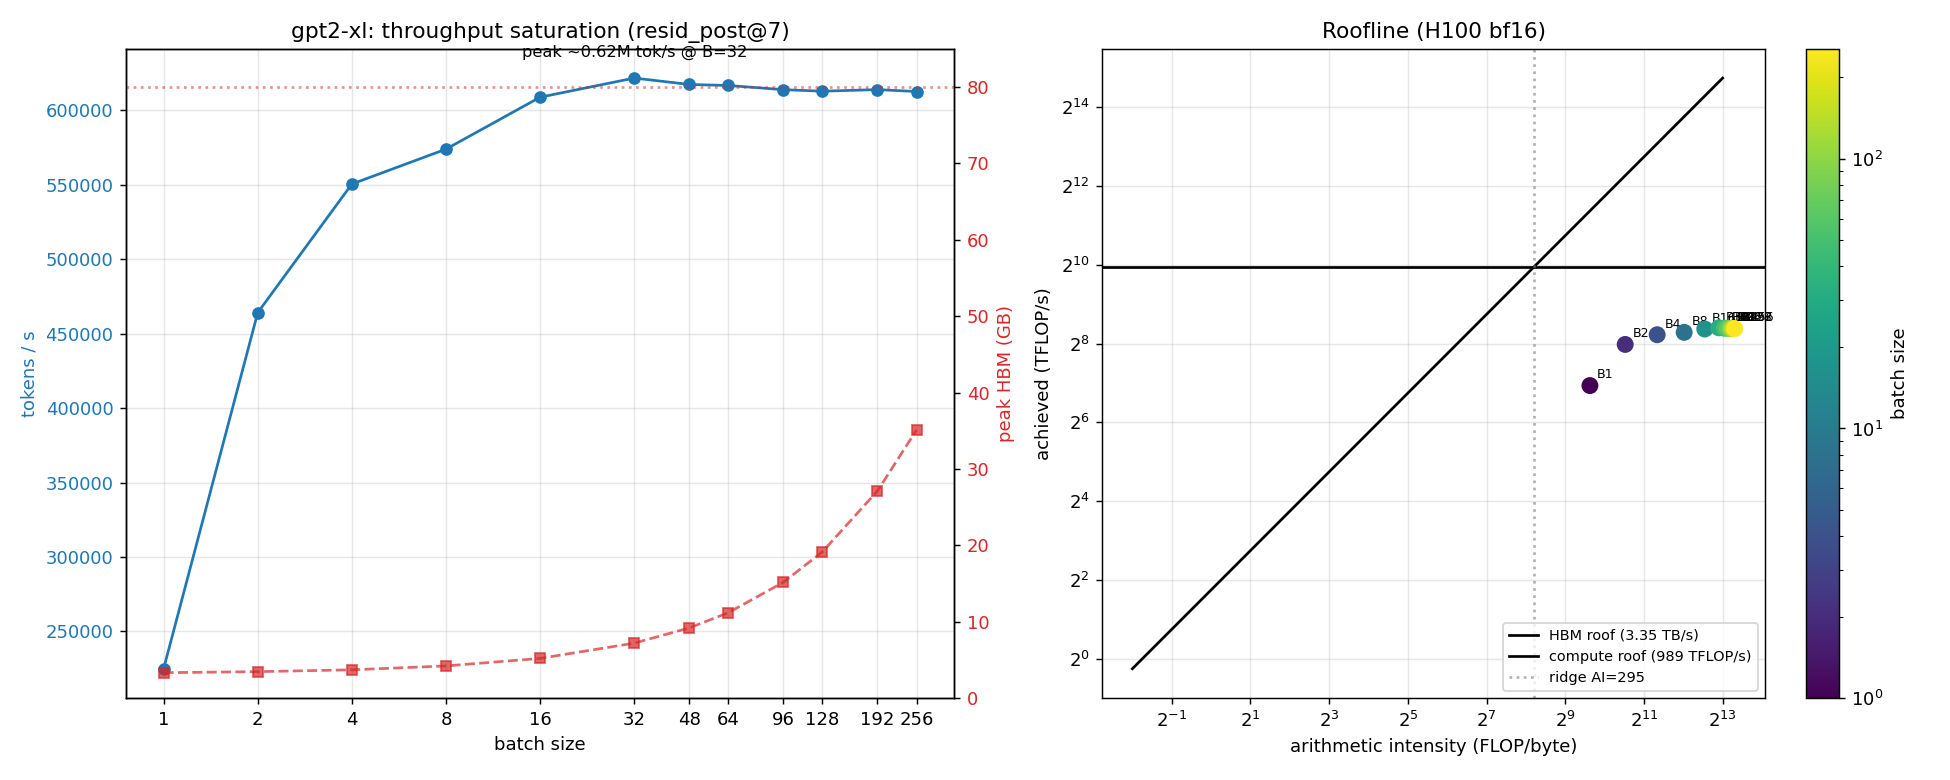
The left panel is the whole argument. Throughput saturates at batch 16–32 (peak ~0.62M tok/s at B=32; B=16 is already ~98% of it) and is flat-to-down after that. Batch 32 is already 32,768 tokens of parallel work per step — more than enough to fill the GPU. Everything past it just spends HBM and coarsens my resume granularity for zero speedup. The memory ceiling of ~2000 is irrelevant; you hit the compute saturation knee two orders of magnitude sooner.
The right panel is the roofline, and it carries the subtler lesson. Every point sits far to the right of the ridge, so the workload is nominally “compute-bound” — but it tops out at ~34% of the H100’s 989 TFLOP/s bf16 peak, well below the compute roof. So it’s compute-bound and leaving most of the machine on the table. Why?
torch.compile buys 39%, CUDA graphs buy nothing
The naive roofline aggregates the whole forward into one dot, but a transformer forward is really a mix: big matmuls (compute-bound) interleaved with LayerNorm, GELU, residual adds, and softmax — all of which are memory-bandwidth-bound elementwise/reduction kernels that do almost no math but still round-trip the [32768, 1600] residual tensor through HBM between every matmul. That HBM traffic is the wall-clock the roofline dot is hiding.
torch.compile fuses those bandwidth-bound ops into the matmul epilogues, so they stop making separate HBM passes:
| config | B=32 tok/s | % of 989 peak |
|---|---|---|
| eager | 620k | 34% |
torch.compile (default) |
862k | 47% |
torch.compile (CUDA graphs) |
862k | 47% |
A free +39%. And the second surprise: CUDA graphs (reduce-overhead) add exactly nothing at B=32. That’s a real result, not a non-result — it says kernel-launch overhead is already amortized at this batch size (it only hurt tiny batches, where B=1 sat at 12%). So the remaining gap to peak isn’t launch overhead and isn’t fusable memory traffic anymore; it’s the matmuls themselves, capped by tile/wave quantization on gpt2-xl’s dimensions (d_model 1600 = 12.5×128, not a multiple of the 128 MMA tile). That’s structural to the model — chasing it further would mean fp8 (which corrupts the activations I’m trying to collect) or a differently-shaped model. So ~47% is the honest ceiling here, and B=32 with compile is the answer. I turned compile on by default.
Reframed: at 862k tok/s, the entire 30M-token forward is ~35 seconds of pure compute. Which means the pipeline, not the GPU, is about to be the bottleneck.
The writer: the part that was actually slow
The first full run collected all 30M activations correctly — 30 shards, 90 GB, every row finite — in 256 seconds, or 117k tok/s. That’s 7× slower than the 862k the GPU can do. The forward wasn’t the problem; something was serializing behind it. Rather than guess, I instrumented each stage of the loop (with cuda.synchronize to attribute GPU time honestly) and ran a short profile:
| stage | % of wall time | what it is |
|---|---|---|
| forward | 32% | compute (incl. one-time compile) |
put |
31% | main thread blocked — the writer couldn’t drain its queue |
d2h |
19% | synchronous device→host copy, serialized with the forward |
| writer drain | 12% | final flush |
| dataloader | 6% | tokenized chunks |
So ~50% of wall time was the copy/writer path blocking the forward — exactly the thing you’d hope a background thread already hides, but wasn’t. Two concrete culprits. First, the old writer did a 3 GB torch.cat + serialize + fsync per shard; while it was busy the bounded queue filled and the producer blocked (that’s put). Second, .to("cpu") onto pageable memory is a synchronous copy that can’t overlap compute (that’s d2h).
The fix is the standard double-buffered producer/consumer, done properly:
- Preallocated pinned shard buffers. Each batch’s D2H lands directly into a slice of the current shard buffer — no intermediate tensor, no
torch.catever. - A background saver on the other buffer. When one buffer fills it’s handed to a writer thread that saves it (
tmp → fsync → rename) while the main thread keeps filling the second buffer. The producer only blocks if all buffers are in flight — i.e. the disk can’t keep up. I assumed that never happened here; it turns out it does, a bit, and the next section is me measuring it instead of assuming. - A dedicated CUDA copy stream. The D2H runs
non_blockingon a side stream so the next forward overlaps the copy. Correctness needs care:record_streamkeeps the GPU source buffer alive until the copy finishes, and a per-shard CUDA event makes the saver wait until every async copy has landed before it serializes the buffer.
Result on the full 30M-token run: 256 s → 102 s, 117k → 295k tok/s, a 2.5× speedup, with byte-identical output and resumability intact. The put stall went from 31% to ~1%. The bottleneck moved back onto the forward, which is where you want it.
A correction: we are a little disk-bound, and I could prove it
I originally waved this away — “the sustained write rate is ~375 MB/s, far under NVMe, so the disk never gates us.” Then I made myself ask the question I’d skipped: are we actually monitoring for the case where all buffers are in flight? We weren’t. So I instrumented it: per-batch D2H throughput (timed with CUDA events on the copy stream, so no host sync and no GIL contention), per-shard disk-write throughput, and — the key one — the time the main thread spends blocked in self._free.get() waiting for a buffer the saver hasn’t returned yet. That last number is the unambiguous “disk can’t keep up” signal.
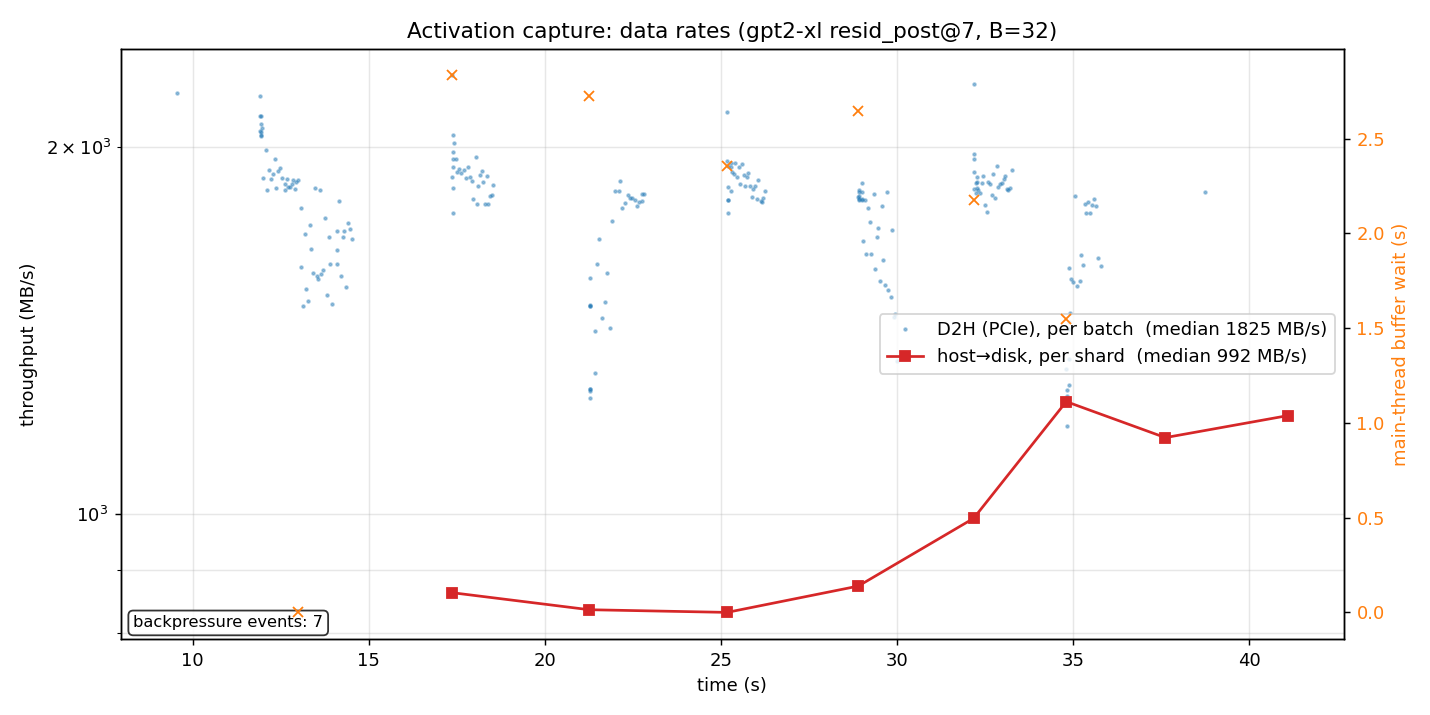
The blue cloud is D2H (one burst per shard, comfortably fast). The red line is the disk: ~1 GB/s per shard flush. And the forward produces activations at ~2.75 GB/s (862k tok/s × 3.3 KB/token). With only two buffers the saver can be at most one shard ahead, so once both fill, the main thread waits — the orange markers, climbing to ~2.4 s per rotation, ~35% of wall time on this run.
So my “375 MB/s” was wrong in an instructive way: that was the whole-run average, which is depressed by the very stall I was claiming didn’t exist — circular. The instantaneous burst rate is what matters, and per burst the disk loses to the GPU. The saving grace is that the average production (dragged down by compile warmup and other overhead) sits below the ~1 GB/s drain, which means the imbalance is bursty, not sustained — exactly the regime that more buffering fixes. I added a --buffers knob and checked: going 2 → 4 buffers dropped the total buffer-wait from ~9.9 s to ~6.9 s, with per-rotation waits collapsing toward zero. Smaller shards would smooth it further. The lesson I keep re-learning: don’t reason about averages when the system is bursty, and add the counter before you assert the bottleneck isn’t there.
Profiling: understanding where the time goes
I’d been meaning to do a “real” profiling pass with Nsight Systems for a while. Then I actually asked what I wanted to learn — where does the 47%-of-peak compute go, and what are those kernels — and it turned out torch.profiler answered all of it in one five-second run, and nsys wasn’t even installed.
The kernel table, after compile, split the compute cleanly: GEMM ~50% (the matmuls), fused elementwise/LayerNorm/GELU ~32%, flash-attention ~18%. Three things fell out of that for free:
- Tile sizes are right there in the kernel names.
nvjet_sm90_tst_128x256_64x4,256x128,192x192— cuBLASLt picked different output tiles for the QKV, MLP, and output matmuls. That’s the “tile size” I was going to open Nsight Compute for, printed by a one-line profiler. - The fusion win is real but has a floor. The elementwise ops are already collapsed into single
triton_poi_fused_add_mul_pow_tanh(that’s GELU) andtriton_red_fused_layer_normkernels — few launches, few HBM passes, which is why eager→compile gave 34%→47%. But they still cost ~32% of compute, because they’re intrinsically bandwidth-bound: streaming a[32768, 1600]tensor through HBM to do almost no arithmetic. You can’t fuse that to zero; I’d already hit the floor. - A live demonstration of the writer lesson. My throwaway profiling script used a plain
.to("cpu"), and the profiler instantly flaggedMemcpy DtoH (Device → Pageable)eating the majority of GPU-attributed time — the exact anti-pattern the pinned-buffer + copy-stream design exists to avoid.
The one question torch.profiler can’t answer is the precise cost of that d=1600 tile misalignment — for the fractional “waves per SM” number you do need ncu on a single nvjet kernel. That’s the genuinely irreducible use of the heavy tools: not “where does time go” (aggregate profilers nail that), but “open this one kernel down to occupancy and SASS.” nsys’s real niche is similarly narrow — a suspected serialization or overlap bug you can’t see in aggregate — which is exactly the class of bug I’d already fixed by construction. So torch.profiler is the reflex, and I reach for the heavier tools only for the one question they uniquely answer.
What’s on disk, and what’s next
The end state: 30 safetensors shards, 29,999,104 rows × 1600 dims in bf16 (~90 GB), captured at blocks.7.hook_resid_post, produced at 295k tok/s, fully resumable. Roughly the shape of every good plumbing job — most of the effort went into making the boring part fast and un-lose-able, and the payoff was three performance intuitions I now trust because I measured them instead of guessing.
Next: actually train the SAE on these vectors, and go looking for interpretable features. That’s the fun part, and it’s the subject of the next post.